Many organizations have achieved growth by expanding their operations globally, resulting in a need for concurrent customer satisfaction tracking in multiple markets. While global satisfaction studies are invaluable in informing management in individual markets how to grow customer loyalty, management at headquarters may want to compare performance across countries to guide their global strategy.
 A challenge in comparing countries in global satisfaction surveys comes from the vast differences across cultures in the use of rating scales. For example, a company may find its operation in China has low satisfaction scores, but the local management may try to explain the problem by saying there is a cultural bias towards rating performance low. Or, results in Chile may be more positive than other markets, with local management taking credit for running their operation better and overlooking the possibility that they benefited from a positive rating bias. Ideally, the senior management of a global organization would like a way of calibrating (or handicapping) results so they can separate actual performance from the cultural effects on how surveys are completed.
Rockbridge has solved this problem in collaboration with faculty from the Center for Excellence in Service at the Smith School of Business, University of Maryland, where Rockbridge is a partner. The core of the approach is to identify and measure different types of response biases that occur in surveys and vary by languages and cultures. By quantifying the biases across markets, it is possible to adjust a key measure such as a summary satisfaction rating or loyalty index. Potential biases that can vary by markets include:
- Tendency to agree or provide positive responses (yea-saying)
- Tendency to disagree or provide negative responses (nay-saying)
- Extreme response bias, or a tendency to use the end-points of scales (negative or positive)
- Mid-point response bias, or a tendency to use the middle range of a scale
- Tendency to answer questions in a careless or random fashion
Each of the five effects can be measured within attribute lists, such as tallying the number of times respondents use the extreme points of a scale. These measures can then be incorporated into a statistical model that measures the impact of the effects and provides a basis for adjusting the satisfaction ratings in each market.
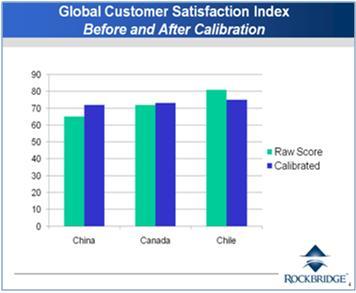
The final outcome is an adjusted customer satisfaction index for each market in a global study. For any given time period, management has a revised set of scores that accounts for the differences caused by response biases, providing a more accurate measure of performance. With a sound calibration approach, management can get a clearer picture, such as knowing that the customers in China really were tough raters or that Chile provided great service, even after accounting for those enthusiastic respondents
For a discussion of the underlying concept described in this article, refer to a paper “Assessing the Impact of Response Styles on Cross-Cultural Service Quality Evaluation: A Simplified Approach to Eliminating the Problem,” Nina Reynolds and Anne Smith, Journal of Services Research, May 2010.