In the past decade, e-services have grown rapidly due to advances in mobile access, connectivity speed and storage capacity. Rockbridge has tracked the incidence of technology-based services continuously for the past 15 years through the National Technology Readiness Survey (NTRS). The list of service technologies we track changes from year to year as new categories emerge (e.g., e-health) and others disappear or become insignificant (e.g., faxes, long distance plans). However, we specifically tracked 25 online service activities from 2009 to 2014, providing a sense of where the fastest growth has occurred in the past 5 years.
The services fall into nine general categories, based on a natural grouping identified through factor analysis, including: e-health, small ticket purchases, entertainment, C2C, big ticket purchases, financial services, e-government, news/research, and e-learning. The fastest growing areas include:
- E-health (155% growth in the past 5 years among the online population)
- Small ticket purchases (46%)
- Entertainment activities (37%).
 Technology-based activities related to government, news/research, and learning experienced the slowest growth from 2009 to 2014, with the change in penetration among online users being flat or negative.
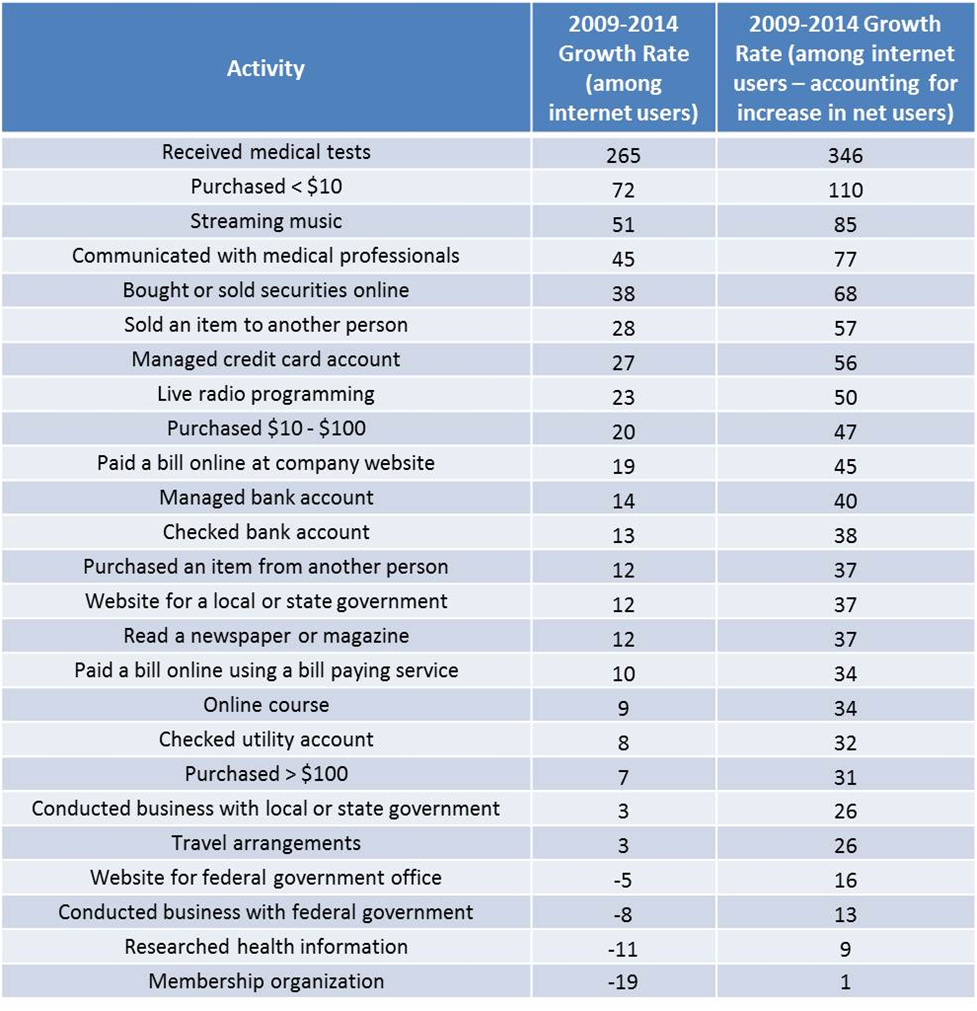
The chart below shows the 2009-2014 growth rates of the 25 technology-based services individually. One column shows the incidence of growth among the online population. The second growth rate column includes an adjustment to account for the increase of internet penetration in the United States from 71% to 87% since 2009. For example, the usage of federal government websites dropped 5% among the online population, but actually grew by 16% among the general population due to increasing numbers of internet users.
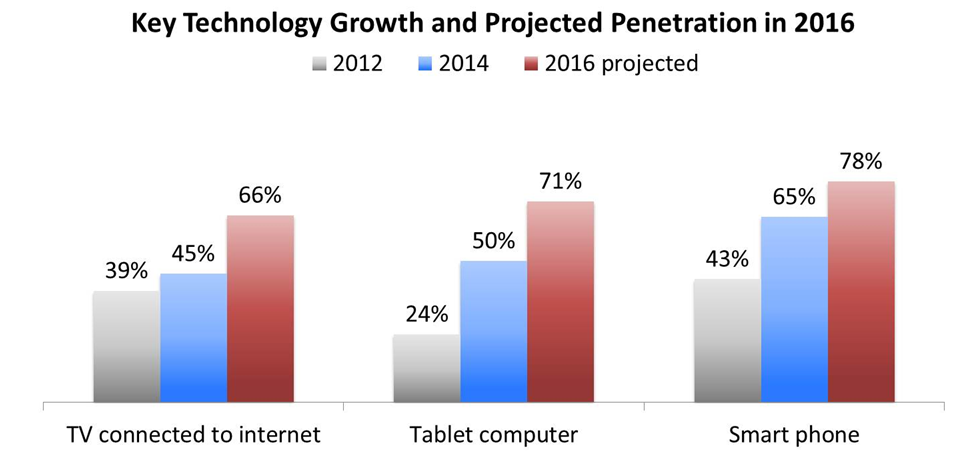
The rapid growth of these e-services is fueled by a few specific factors. First, there has been rapid growth in the adoption of foundational technologies that spur use of online services. Specific examples include smartphones, tablet computers, and televisions connected to the internet providing ease of connectivity to service providers from any location on a 24/7 basis (see chart below). 
Taking into account stated adoption intentions in our survey, these three specific technologies will be in use by two-thirds of the U.S. adult population by 2016. These technologies can have a profound impact on behavior; for example, consumers can use tablets or smartphones to purchase online while in a physical store, while smart TVs greatly enhance access to digital content.
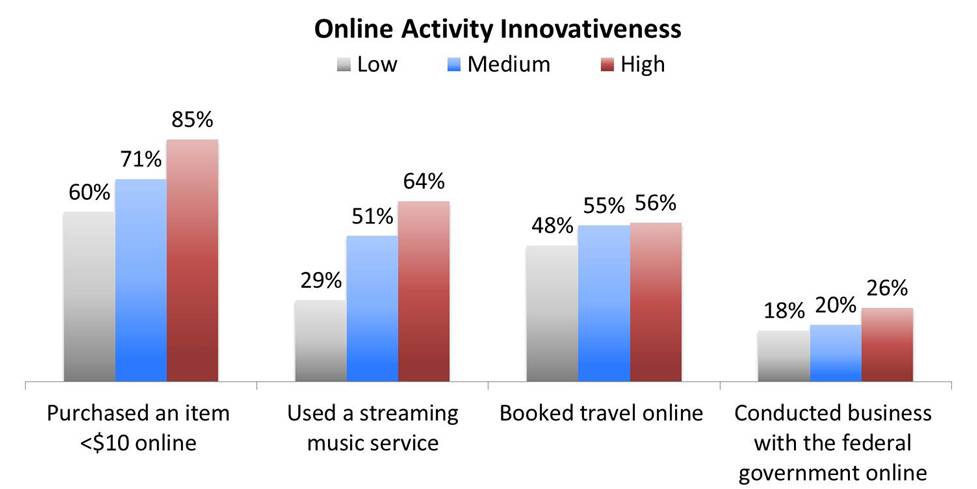
Another factor behind growth is the innovative nature of services and their ability to deliver latent benefits to the market in the long run. Evidence of a service’s innovative nature is revealed by the correlation between its adoption and the level of “technology readiness” of users as measured by the Technology Readiness Index (TRI), a proprietary metric captured in the NTRS. To illustrate this phenomenon, the figure below compares the adoption rates of two fast growing services and two slow growing services among consumers who rank “low,” “medium” and “high” on the TR index. In the example, the use of streaming music services and purchasing small items online is much higher among more innovative consumers, suggesting these leading edge consumers recognize unique benefits (e.g., convenience and variety) that other consumers will ultimately embrace. On the other hand, booking travel online and doing business with the federal government online are no longer unique to the most techno-ready consumers, which is reflected in their slow growth rates.
A final factor in the growth of technology-based services is the degree to which they are pushed into the market by service providers. While forcing consumers prematurely to use technology-based services will theoretically lead to dissatisfaction and churn, there are sectors where consumers have limited options and/or motivation to push back. A good example is healthcare, where the technology options available are far less important than cost, coverage and the quality of caregivers. E-health activities such as communicating with a doctor or receiving test results are the fastest growing services since 2009, most likely due to a major push towards online models in the healthcare in the U.S. in the past few years.
Our ongoing research on technology trends shows the importance of foundational technologies (e.g., high speed internet and smartphones) on the adoption services (e.g., retailing and financial services). However, the innovative nature of an e-service matters too. Special attention should be focused on services with a high correlation to Techno-Readiness. For a true innovation, providers should use strategies to appeal to early adopters as evangelists in early growth stages, and later, to overcome usability and insecurity issues and clearly demonstrate product benefits to move the innovative service along an adoption curve.
About this Study: the 2014 National Technology Readiness Survey is based on an online survey of 1230 U.S. adults sampled at random from a consumer research panel. The survey was conducted in February 2014, and results are weighted to match Census Bureau data. The margin of error for the study is +/-3 percentage points. The study is co-sponsored by Rockbridge Associates, Inc. and the Center for Excellence in Service at the Robert H. Smith School of Business, University of Maryland, College Park.
Written by: Charles Colby, Chief Methodologist