CEOs the world over have come to recognize the importance of building a loyal customer base to the success of their organizations. To achieve this goal, firms worldwide have adopted holistic customer experience management programs with the aim of improving the share of business that customers allocate to their brands. In fact, 65% percent of companies have a senior executive in charge of their company’s customer experience efforts, and companies spend billions of dollars each year to improve the customer experience. Because of the high cost of acquiring new customers, this strategic emphasis on improving the customer experience is without question the right thing to do.
However, just because something is the right thing to do does not mean that it is done the right way. Research has found that most efforts to improve the customer experience result in low, even negative returns on investments even when they result in higher customer satisfaction levels or Net Promoter Scores (i.e., NPS, a measure of customers’ willingness to recommend a brand). Why does this occur? Because improving satisfaction or NPS levels serves as the primary goal for customer experience programs, but these metrics have almost no relationship to how customers divide their wallets among competing brands. How bad is it? On average, 99% of “why” customers divide their spending is completely unexplained by knowing satisfaction or NPS!
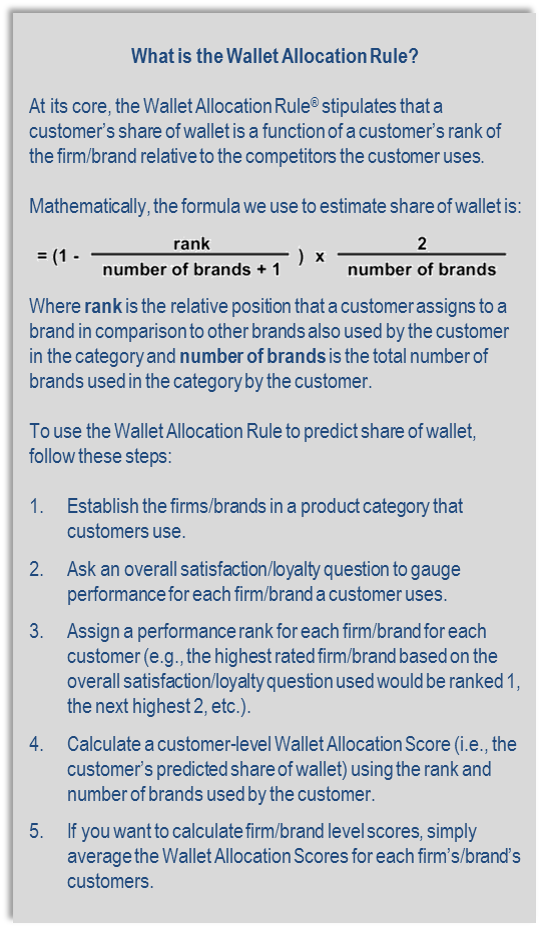 Fortunately, groundbreaking research provides a solution to this problem—the Wallet Allocation Rule® – the subject of a New York Times book and award winning, peer-reviewed scholarly research. The fundamental tenet of the rule is that rank matters more than absolute performance, so satisfaction should not be measured as if it existed in a competition-free vacuum. Managers typically focus their efforts solely on the score that customers give to their firm. For example, firms frequently tout their Net Promoter Scores to shareholders as proof that their companies should expect future revenue growth. The faith that a single metric predicts business success is so strong that managers’ bonuses are typically tied to achieving designated customer satisfaction or Net Promoter targets.
The problem is that these target levels lack context. For example, most managers consider a rating of “9” (where “10” is the best) to be a good score. Using the Net Promoter System, customers who rate your brand a 9 or 10 are considered Promoters, which is the goal of the approach. The hitch is that customers may provide equally high scores to other brands they shop; our research finds if a customer is a Promoter for your brand and also uses one or more competing brands, 80 percent of the time the customer is also a Promoter for the competition, and frequently the competitor is rated higher despite the customer being classified as a Promoter for both organizations. Clearly, a system that cannot distinguish winners from losers has major flaws.
Our research has found a simple solution to this problem: instead of focusing on a customer’s satisfaction rating (or Net Promoter score), we focus on the relative rank that this satisfaction score represents vis-à-vis the competitors the customer also uses. To see how this works, imagine that your firm has two customers—John and Mary—who both rate your brand a “9”.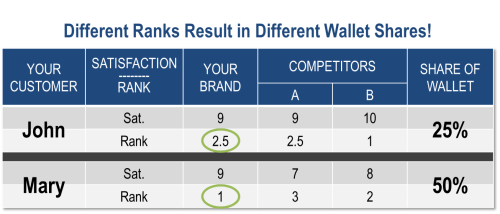 Using the Net Promoter classification system, both John and Mary are Promoters of your brand. However, John and Mary, also use two of your brand’s competitors: Brand A and Brand B. John rates his level of satisfaction with Brand A a “9” and his satisfaction with Brand B a “10”. On the other hand, Mary rates her level of satisfaction with Brand A a “7” and with Brand B an “8.” Despite the fact that John and Mary both rate your brand a “9” and are Promoters, your brand is Mary’s clear first choice, while it is tied for John’s last choice. The result of this difference in rank is that we can confidently predict that Mary will allocate twice as much a share of her category spending with your brand than John does.
Shifting the focus from raw scores to competitive rank dramatically improves the relationship between satisfaction (and Net Promoter) and share of wallet. Moreover, by using the Wallet Allocation Rule® to transform rank into predictions of customers’ share of wallet levels, managers can finally bridge the gap between the metrics they are tracking and customers’ spending behaviors.
Using the Wallet Allocation Rule also has serious implications for identifying where companies should focus their finite resources to improve the customer experience, as drivers of rank are not typically the same as drivers of satisfaction or NPS. To illustrate the differences, let’s look at one of the best industries in the world when it comes to satisfying their customers: credit unions in the USA. Credit unions serve over 90 million members in the United States. They differ from other financial institutions in that they are non-profit, member owned institutions. In general, however, USA credit unions offer most of the same core services as their retail banking competitors (e.g., checking, savings, CDs—although they may use different names for these services). Credit unions typically have much higher satisfaction and NPS levels than their banking competitors. In fact, they have achieved record high satisfaction levels when compared with all other industries in the USA.
An analysis of what drives satisfaction (or NPS) with credit unions reveals that the most important predictor is the company’s resolution of customer complaints. This makes sense because fixing problems is bound to have a positive impact on customers’ overall satisfaction levels. But if you really think about it, pouring resources into complaint resolution is unlikely to improve a credit union’s market share because customers are unlikely to select a credit union because it is good at resolving complaints.
By contrast, the research uncovered that the most important driver of rank (and ultimately share of deposits) was the competitiveness of fees. Low fees are a key strength of credit unions when compared to banks. However, despite lower fees, better complaint resolution, and considerably higher overall satisfaction (and Net Promoter Score) levels, the majority of credit union customers also felt the need to use one or more competing financial institutions. A separate analysis reveals why. The most important reason that credit union members were also using a bank was to receive high quality Internet banking services, a strong feature of banks compared to credit unions.
This example highlights the need for understanding drivers beyond traditional satisfaction frameworks. An analysis of the drivers of rank, which predict share of wallet, are different from the drivers of satisfaction, leading to different management priorities. Credit unions should identify the drivers where they can make significant improvements (in this example, Internet banking) and dedicate their resources accordingly. In fact, one of our credit union clients recognized this challenge and invested in sophisticated online banking and mobile banking solutions.
As this example makes clear, a misguided pursuit of satisfaction and NPS is unlikely to result in improved financial performance. This should not be taken to mean that satisfaction is not important. To be crystal clear, measuring, modeling, and managing customer satisfaction is more important than ever. But if the goal is improved share, then traditional satisfaction and NPS approaches won’t cut it. These measures must be put in context of the real-world choices that customers make each and every day. This is achieved by applying the Wallet Allocation Rule framework, and using it to identify what really drives customers’ decisions to allocate more (or less) of their wallets to the brands they use.
 The Rockbridge MaxShare™ solution is the only Wallet Allocation Rule® Certified solution available on the market.
The Wallet Allocation Rule® was created by Rockbridge Chief Strategy and Client Officer Timothy Keiningham, Ph.D. with academic colleagues from Fordham University and Vanderbilt University.